Quantifying the risk of an AI bubble
Shreyas Veturi
Previous investment in technology has been far outshone by investment in AI since 2023, with firms such as Microsoft, Amazon, Google and Nvidia splashing hundreds of billions into data centres and model training infrastructure. A result of this has been Nvidia surpassing a valuation of $2.5 trillion. For some, this could suggest evidence of a technological transition. For others, it represents a sign of investor overexcitement reminiscent of the late 1990s dot-com boom.
These concerns have been voiced by the IMF and the Bank of England, which both warn that the current speed and scale of investment in AI resemble patterns seen before previous market corrections. In Q1 2025, 58% of all global venture capital went to AI startups. This concentration was unseen in other sectors. Public enthusiasm for “AI Stocks”, tracked through Google Trends, has risen significantly, matching this excitement. Naturally, this raises the question of whether the basis of this boom is speculation or true economic value.
The scale of corporate expenditure on developing AI infrastructure makes this question more pressing. Amazon Web Services (AWS) has pledged $150 billion to build new data centres, while Microsoft has strengthened its partnership with OpenAI through multi-year investments. The increasing demand for Nvidia’s GPUs has started to push costs sharply upward, creating supply shortages and, therefore, incentives for companies to hoard chips and rent computational capacity beyond their current requirements. This defensive investment behaviour indicates not only confidence in expected returns but also a fear of exclusion.
Investment in AI will strengthen its capabilities and accelerate adoption, yet the rapid pace raises familiar concerns. It has been noted that we may be entering the early stages of a ‘hype cycle’. This is where optimistic market sentiment and capital flows outpace economic output, which may indicate that the foundations of this boom are fragile.
Situating the boom within a broader economic context can provide a better understanding of whether it represents a genuine technological transition. Historically, in the short term, major innovations have attracted levels of investment that exceed performance before yielding long-term productivity gains. Economist Joseph Schumpeter coined the term “creative destruction” for this process. He describes the phenomenon where transformative technologies attract capital rapidly, displacing older systems in the process, but also generating periods of instability. Many technologies viewed as essential, such as railways, electrification and the internet, underwent dramatic booms and market corrections before reshaping the global economy.
Behavioral economics lends further insight. Yale professor Robert Schiller’s work on “irrational exuberance” suggests that narratives, or the belief that others will keep buying, drive the performance of asset prices more than core fundamental indicators. Keynes’ “beauty contest” analogy and George Soros’ theory of reflexivity reinforce this point: rising prices can feed into speculation of inevitable success, which in turn pushes prices higher until reality and expectations diverge.
This suggests that rapid investment surges are not inherently irrational but carry some excess. AI could follow the Schumpeter’s “creative destruction” pattern, but for further insight, quantitative methods must be employed to test the integrity of the boom empirically.
A regression model can be employed to assess the main thesis. This analysis allows one to determine whether daily changes in share prices for AI companies are more strongly linked to company fundamentals or shifts in public interest. The regression equation can be shown as follows:
ln(Share Price) = α + β1(Fundamentals) + β2(Public Excitement) + ε
Taking the natural logarithm of a company’s daily share price serves two purposes. It smooths out any large jumps in price, making time-series analysis easier. It also allows price changes to be interpreted in percentages, which is more useful in volatile markets when the purpose is to analyse why the price changes from one day to the next, rather than using numeric values.
‘α’ is a constant term capturing the average level of the log share price that has not been accounted for by fundamentals or excitement. Essentially, having this term ensures that the regression line fits the data properly.
β1 (Fundamentals) measures a company’s economic performance. Fundamentals are a business’s financial indicators of success - in this case, revenue. The beta coefficient represents the responsiveness of the share price to a change in fundamentals. A positive coefficient means that stronger fundamentals are associated with higher prices. A negative one indicates that fundamentals are not contributing, perhaps even moving in the opposite direction.
β2 (Public Excitement) captures public attention, derived from data from Google Trends for the term “AI Stocks”. A higher value suggests more people are looking up information about AI-related equities, serving as a proxy for market sentiment. This beta coefficient measures the responsiveness of the share price to a change in excitement. A positive one represents a positive association.
Finally, epsilon (ε) represents error, or everything not accounted for by fundamentals or excitement, comprising mainly day-to-day noise and randomness.
To perform the analysis, daily stock prices and revenue were collected using the publicly available Yahoo Finance library since the start of 2023 for Nvidia, the only large AI company with sufficient data points to perform a reliable analysis. The datasets of sentiment curated from Google Trends and the prices and fundamentals were matched by date to enable comparison.
Figure 1: Regression results for Nvidia.
Figure 2: Regression graph generated for Nvidia. Log price against standardised sentiment.
Figure 1 shows that the regression yields a negative β1 of -4.62 (with the p value < 0.001) and a marginally positive β2 of 0.049 (p = 0.05). This suggests that Nvidia’s daily share price movements are not explained by fluctuations in performance. It also indicates that higher public interest in “AI Stocks” is associated with higher prices. Therefore, speculation, rather than fundamentals, has been the marginal driver of Nvidia’s valuation pattern.
The regression graph of Figure 2 further emphasises this. It shows the widely scattered cloud of log prices and a shallow, upward-sloping regression line when fundamentals are constant (to provide a ceteris paribus analysis). Daily price variation is noisy, but there is a consistent weak positive correspondence with a higher price level. This means that sentiment exerts a measurable influence on Nvidia’s share price. The limitation of this is that it only explains a small amount of short-run volatility.
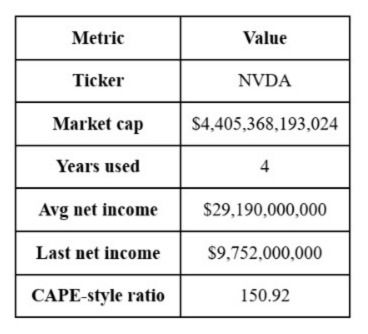
Figure 3. Nvidia market cap/income and CAPE ratio.
CAPE = Market Capitalisation/ Average Real Earnings over the Previous 10 Yrs
Figure 4. CAPE ratio formula
Another metric used to show the extent of Nvidia’s valuation stretch is the Cyclically Adjusted Price-to-Earnings (CAPE) ratio. The equation is presented in Figure 4. It compares a firm’s current price to inflation-adjusted earnings over time, usually ten years. Here, data was only freely available for four.
This was developed by Schiller to identify periods when asset prices became detached from long-run earnings. In times preceding past market corrections, most notably the dot-com bubble, CAPE ratios rose rapidly as prices increased faster than earnings. Figure 3 shows that Nvidia’s CAPE ratio was approximately 151. This extraordinary level means that investors are pricing the firm at roughly 151 times its average recent earnings, inconsistent with sustained future growth. A high CAPE ratio does not imply an imminent correction but reinforces the evidence that Nvidia’s valuation is derived more from anticipated future potential.
However, it is possible that current AI valuations are not purely driven by speculation but rather by elements of rational investment too. Previous bubbles were based on intangible and non-productive assets. AI investment finances data centres and distributed computing systems, which retain lasting economic value. Schumpeter’s perspective that new technologies would produce delayed long-term value is echoed by the IMF, who believe that AI’s long-run potential justifies the current mismatch between earnings and price. The private sector provides an optimistic forecast, with Goldman Sachs estimating that AI has the potential to raise global GDP by 7% over the next decade. The emergence of the US CHIPS Act, the EU Act and the UK’s front show that governments are also backing the sustained success of AI.
In the future, should valuations correct sharply, the consequences could mirror those of the dot-com boom. Layoffs, contractions in venture funding and a deceleration of innovation could be experienced.
The Bank of England has warned that the oligopolistic market of AI-exposed firms may amplify risks. Conversely, if growth persists, there could be substantial productivity gains to vindicate current investment levels. Regulators, as a result, are placed in a delicate position to prevent speculative imbalances while also avoiding interventions which could stifle technological progress.
Whether the current AI boom represents a bubble or a rational investment cycle is dependent on how effective the deployment of capital has been, rather than how much of it has been spent. The OECD calls for greater transparency in how AI firms generate profits and manage data. McKinsey emphasises that how investment is allocated, rather than the scale of spending, will determine whether AI achieves its projected economic impact.
References:
-
AP News. “AI Bubble Warnings as Bank of England and IMF Raise Concerns.” AP News. Accessed January 29, 2026. https://apnews.com/article/ai-bubble-warnings-bank-of-england-imf-b15e54f6d06992371ee39b27f4e6da3a
-
PitchBook. “AI Startups Attract 57.9% of Global Venture Capital in Q1 2025 as FOMO Drives Deal Activity.” PitchBook, 2025. https://pitchbook.com/news/articles/ai-startups-57-9-percent-global-venture-dollars-fear-of-missing-out-drives-up-dealmaking-q1-2025
-
FTI Consulting. “AI Investment Landscape 2025: Opportunities in a Volatile Market.” FTI Consulting. Accessed January 29, 2026. https://www.fticonsulting.com/insights/articles/ai-investment-landscape-2025-opportunities-volatile-market
-
Al Jazeera. “IMF Warns AI Investment Bubble Could Mirror Dot-Com Crash.” Al Jazeera, October 14, 2025. https://www.aljazeera.com/economy/2025/10/14/imf-says-ai-investment-bubble-could-burst-comparable-to-dot-com-bubble
-
Bank of England. Financial Stability Report: July 2025. London: Bank of England, 2025. https://www.bankofengland.co.uk/-/media/boe/files/financial-stability-report/2025/financial-stability-report-july-2025.pdf
-
Google. “Google Trends: AI Stocks.” Google Trends. Accessed January 29, 2026. https://trends.google.com/trends/explore?date=all&q=AI%20Stocks
-
Goldman Sachs. “How Will AI Affect the Global Workforce?” Goldman Sachs Insights. Accessed January 29, 2026. https://www.goldmansachs.com/insights/articles/how-will-ai-affect-the-global-workforce.html
-
Organisation for Economic Co-operation and Development (OECD). Digital Economy Outlook. Paris: OECD Publishing. Accessed January 29, 2026. https://www.oecd.org/digital/digital-economy-outlook/
-
McKinsey & Company. “The Economic Potential of Generative AI.” McKinsey Insights. Accessed January 29, 2026. https://www.mckinsey.com/capabilities/quantumblack/our-insights/the-economic-potential-of-generative-ai