Invisible No More: The Structural Transformation of Women's Labour
by Amba Arjun
The Measurement Problem
Economic history is often told as a story of markets, production and growth. But it is overlooked that for much of that history, women powered the economy in ways that it refused to see. Cooking, caregiving and domestic organisation sustained economic life, yet because this labour was unpaid, it remained statistically invisible. The result was not that women contributed less, but that their contribution was never counted: an “invisible economy” hidden beneath the surface of GDP.
At its core, this omission reflects how economists have traditionally defined production. A more complete representation of economic activity can be defined as:
Total Output = Market Production + Household Production
For decades, only the first term was measured while the second remained severely overlooked, masking the true scale of women’s efforts. Today, the picture looks very different. In the UK, 16.7 million women are in employment, with a participation rate exceeding 72%, reflecting a profound shift in how work is organised.(1) But this transformation was not about women beginning to work; it was about their work becoming visible. As Mariana Mazzucato argues in another context in “The Value of Everything”, value is often created long before it is measured. Women’s labour is one of the clearest examples of this disconnect. (2)
Tracing the Visibility Shift
Chart 1 traces female labour force participation in the United Kingdom over the past century, drawing on long-run data from OWiD.(3) The pattern is unmistakable. In the early twentieth century, only around a third of working-age women were formally employed. Today, participation is close to 60%, reflecting a dramatic expansion in women’s economic visibility.(4)
This rise represents one of the most significant labour market transformations in modern history. Yet, these patterns must be interpreted with caution as they do not show women entering the economy for the first time, rather, they capture women’s transition into the “measured” economy. Historical evidence suggests that women were already engaged in substantial productive activity within households and informal settings, long before such work was recorded in official statistics.(5)
This trajectory also aligns with the U-shaped relationship between economic development and female labour force participation, first formalised by Claudia Goldin, which shows that women’s measured employment often falls during industrialisation before rising again as education expands and service-sector opportunities grow.(6) In early agrarian economies, women’s participation was high but largely unrecorded. Industrialisation then reduced measured participation as work shifted into factories and social norms constrained female employment. The sharp rise observed from the mid-twentieth century reflects the right-hand side of this curve, as expanding education and new employment opportunities drew women back into the formal labour market.
The Shape of Women’s Work
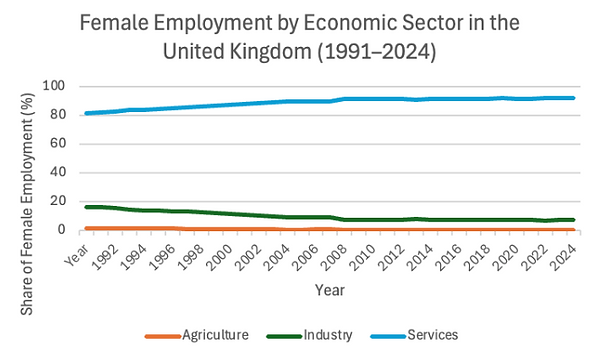
While Chart 1 shows the rise in participation, Chart 2 reveals where that work now takes place. Using OWiD and ILO data, it shows that, in the UK today, over 85% of employed women work in the service sector, while agriculture has almost disappeared and industry has steadily declined.(7) This reflects a broader transformation across advanced economies, where growth has shifted toward services such as healthcare, education, finance, and professional roles.
This shift is reinforced by the expansion of the NHS, the growth of the education sector and the rise of knowledge-based industries have all created jobs disproportionately filled by women. At the same time, increasing female university participation, now exceeding 55% of undergraduates in the UK, has supplied the skills these sectors demand.(8)
Crucially, many of these roles mirror tasks historically performed within households. What changed was not the nature of the work, but its location, moving from unpaid domestic labour into the formal economy, where it could finally be measured.
From Patterns to Proof
To examine the patterns in the charts more formally, the same data was used to estimate a simple time-series regression that links female labour force participation (FLFP) to the share of female employment in the service sector:
The results prove to be striking as a one percentage point increase in the service-sector share is associated with a 0.58 percentage point rise in female participation, with the model explaining nearly 87% of the variation over time. This is an unusually strong relation suggesting that the expansion of service-sector employment was closely tied to rising participation, rather than merely coincidental. This aligns with the work of Nancy Folbre, who emphasises that care work has long been undervalued and excluded from economic measurement, only becoming visible as it shifts into market-based services.(9)
Extending the model to include other sectors yields:
However, industry is omitted due to “perfect multicollinearity", as sectoral shares must sum to 100%. This highlights a key insight: the regression captures not independent sectoral differences, but the reallocation of labour across sectors. Within this framework, agriculture shows a negative but statistically significant coefficient, while services remain the dominant driver. This lends empirical weight to the argument that the rise in female labour participation was not merely a demographic or social shift, but closely tied to the evolution of the economy itself.
Invisible, But Not Gone
The long sweep of economic history makes one thing clear: women’s labour has not simply increased, it has been reclassified. Over the past century, female participation in the UK has risen steadily, reaching over 74% by 2018, driven by structural change, shifting norms and expanding opportunities.(10) But even as women have entered the formal labour market in unprecedented numbers, the invisible economy has not disappeared.
Instead, it has evolved.
Falling fertility rates tell part of the story. In nineteenth-century England, women often had more than 6 children, whereas today, fertility has fallen well below replacement levels.(11) This shift has freed time for paid employment, but has also redistributed, rather than eliminated, unpaid labour. Care, coordination, and domestic work still persist, often alongside formal employment, creating a “double burden” that continues to shape women’s economic lives.(12)
At the same time, the persistence of the glass ceiling reminds us that visibility does not guarantee equality.(13) Women are present in the labour market, but not always proportionately represented at the top, reflecting enduring structural and institutional barriers.
The lesson is not that the invisible economy is gone, but that it remains embedded within the visible one.
Women’s work was never absent, only unmeasured. Today, more of it is priced and visible, yet a vast share remains outside GDP, silently holding up the economy that still struggles to see it.
References:
-
House of Commons Library. “Women and the UK Economy,” February 25, 2026. https://commonslibrary.parliament.uk/research-briefings/sn06838/.
-
Mazzucato, Mariana. “T H E VA L U E O F E V E RY T H I NG: Making and Taking in the Global Economy,” 2018. https://issc.al.uw.edu.pl/wp-content/uploads/sites/2/2022/05/The-Value-of-Everything.-Making-and-Taking-in-the-Global-Economy-by-Mariana-Mazzucato.pdf.
-
Our World in Data. “Female Labor Force Participation Rate,” January 28, 2026. https://ourworldindata.org/grapher/female-labor-force-participation-long-run.
-
“SuperJS Check,” n.d. https://www.theglobaleconomy.com/United-Kingdom/Female_labor_force_participation/#:~:text=The%20latest%20value%20from%202024,and%20those%20who%20are%20unemployed.
-
Erikson, Amy. “The Cambridge Group for the History of Population and Social Structure.” University of Cambridge, n.d. https://www.campop.geog.cam.ac.uk/blog/2024/08/08/women-have-always-worked/.
-
AnguyoI, and AnguyoI. “What Claudia Goldin Taught Economics About Women, Labour Markets and Pay Gaps | LSE British Politics.” LSE British Politics | Informed Debate for Better Governance (blog), November 13, 2023. https://blogs.lse.ac.uk/politicsandpolicy/what-claudia-goldin-taught-economics-about-women-labour-markets-and-pay-gaps/#:~:text=Drawing%20lessons%20from%20history,advantages%20in%20non%2Dmanual%20jobs.
-
Our World in Data. “Share of Female Employment by Economic Sector,” n.d. https://ourworldindata.org/grapher/share-of-female-workers-by-sector.
-
Explore Education Statistics - GOV.UK. “School Workforce in England, Reporting Year 2024,” June 5, 2025. https://explore-education-statistics.service.gov.uk/find-statistics/school-workforce-in-england/2024.
-
Great Transition Initiative. “The Caring Economy: Well-Being and the Invisible Heart,” October 27, 2021. https://greattransition.org/publication/the-caring-economy#:~:text=Economics%20should%20recognize%20that%20unpaid,for%20society%20as%20a%20whole.
-
“Long-term Trends in UK Employment: 1861 to 2018 - Office for National Statistics,” n.d. https://www.ons.gov.uk/economy/nationalaccounts/uksectoraccounts/compendium/economicreview/april2019/longtermtrendsinukemployment1861to2018.
-
Pooley, Siân. “Parenthood, Child-rearing and Fertility in England, 1850–1914.” The History of the Family 18, no. 1 (March 1, 2013): 83–106. https://doi.org/10.1080/1081602x.2013.795491.
-
UNDP. “Women’s (double) burden,” February 26, 2018. https://www.undp.org/kosovo/news/womens-double-burden.
-
Morson Jobs. “Is It Double-glazed? Why Britain Still Hasn’t Broken the Glass Ceiling,” n.d. https://www.morson.com/blog/Britain-Glass-Ceiling.